 If a school is going to bog-down in the process of using data, it will most likely be in this area. Once you identify your lead metrics, you, as an administrator must determine the most effective way to track and report the data. If you simply ask your educators to collect and report the data, you have failed this step, since you just became a barrier in their ability to accomplish the actions you’re asking them to improve. We call that dumping on your educators. Don’t do that!
Instead, either build or find a collection system that meets your needs and automates as much of the process as possible. In our case, this school found a system that met their data collection needs without adding barriers for educators to meet the action improvement goals with Pulse.

With Pulse they were able to track staff communication rates and quality, student time-on-task, log-in-rate, and progress metrics, daily and weekly attendance rates, and student communication rates. By automating the collection process staff were more open to learning how best to monitor these metrics to help improve student engagement and course completion rates. Pulse was a game-changer in developing a simple and convenient way to integrate the use of data into the operating model of the school. We’ll discuss the reporting process created next.
How to Effectively Report Outcomes – Benchmarks
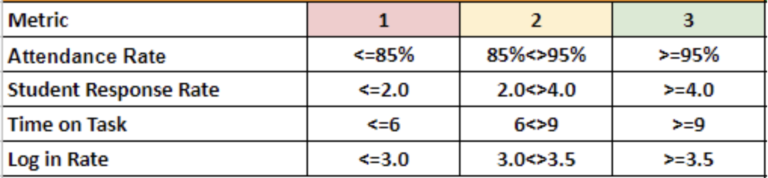
Once you’ve identified your lead metrics and either found or created a data collection tool, it’s time to develop your benchmarks to help you categorize your results effectively. To evaluate the appropriate categories you would need to track those metrics for a period of time. The school we examined had the data tracking tool in place and they were able to rely on past data to identify appropriate benchmarks for the key metrics they needed. As mentioned in a previous blog, they developed the idea of evaluating staff ‘connection’ with students using two variables – attendance rates, and student response rates. They also wanted to closely track how some student engagement statistics like student’s time-on-task and log-in-rates were affected by the connection metrics. Let’s take a minute to clearly define those metrics here.
Attendance Rate – Percentage of the students in the staff members class that had a qualified attendance conversation with the staff member that week (85% means that 85% of the students assigned to that staff member had an educational conversation with the staff member)
Response Rate – The average number of days that students were communicating back to the staff member (a 4 would signify that on average, students assigned to that staff member were replying to the staff members communication 4 out of 5 days within a week)
Time-on-Task – The average number of hours the students were spending in the Learning Management System working on their course. (a 7 would indicate that on average the students assigned to this staff member were spending 7 hours that week working on their course inthe Learning Management System)
Log-in-Rate – They average number of days in a week that the students assigned to the staff member logged into their class and completed work (a 3 would signify that those students logged in on average three days in a five day school week to work on their course)
As discussed previously, the data showed that when attendance and response rates were high, time-on-task and log-in-rates were also higher. Because of the increased work level, courses were completed faster and that would have a positive effect on graduation rates.
The school chose to set their benchmarks accordingly, based on the results they observed.