Blog Series: Data is Your Friend!
Part 1: Find Measurable Lead Metrics

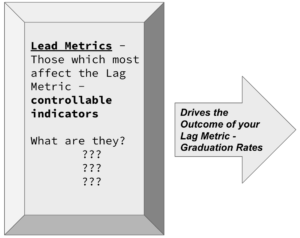
Your research will need to be done around which measurable and controllable variables make a difference in your SMART goal. There are many variables that you could identify which may have an effect on your SMART goal (homelessness, personal barriers, unsupportive parents, poverty, etc.), but are not necessarily controllable by your school. You should take some time to list and discuss these variables because that is very valuable. You may even begin to think about how best to create support opportunities around those issues. Those can become a component part of your behavioral or social support system and will benefit students greatly. Don’t let those become a distraction to the ultimate goal of identifying the main school-related actions that have influence over the goal though.

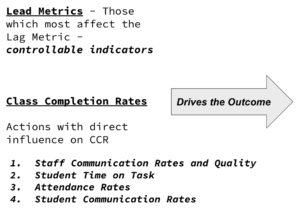
This school took time to research the data. What they found was that students were most likely to graduate when they successfully completed courses. That seems pretty obvious right? They didn’t stop there though. They pulled student completion rates and progress by staff member and course and analyzed the results. What they found was very interesting!
The data they found most promising was contact frequency, communication quality, and attendance rates. They use Pulse to track and monitor these variables. Attendance is tracked daily, staff contact and student response frequency are tracked in live-time, and this data is summarized in individual staff dashboards which gives a perspective on the effect of student/staff connection to course completion. What they found – time and time again – was that where there are high levels of attendance and high levels of text responses to staff member’s text threads, there was a dramatic increase in course completions. Those variables are both measurable and controllable by staff. In other words, there are adult actions that can be done to positively or negatively affect course completion rates and eventually graduation rates through what the school identified as ‘connection’ – attendance and student responses. Those two variables were selected as the Lead Metrics to be used in their improvement approach.

By the time graduation rates are published it is too late to do anything to improve them. Creating metrics and a tracking mechanism around your lead variables allows you to have influence over the outcome of your lag metric. The school was now ready to create a tracking and reporting process to gain further influence over the lead metrics. We’ll discuss that next! Next: Identify Methods to Track Data and Report Outcomes

Since 2011 Chris Loiselle has worked as building administrator, CFO, and Chief Strategic Officer for Success Virtual Learning Centers and Berrien Springs Public Schools, where he is currently filling the Director of Quality Assurance role. While working at Success, Chris was instrumental in the development of the Pulse student support software. His passion is working in K-12 managing e-learning centers and building software to help improve virtual learning outcomes.
Chris has presented on this student data topic at the 2022 Digital Learning Annual Conference and will also be presenting at Quality Matters’ 2022 QM Connect conference November 6-9 in Tuscon, AZ.
His goal is to be able to help people prosper and succeed in today’s challenging educational environment.

